01. Why Pareto Analysis
Resolving some problems involve many possible courses of action competing for attention simultaneously. It’s not as simple as going one way or the other.
In such situations, there is a pressing need to prioritize and focus resources where they are most needed.
And Pareto analysis is just the tool to help decide which courses of action will have the greatest influence on the overall resolution, which ones will have the least, and where precious resources should be best allocated.
Take the video lesson to learn more about this tool.
[showhide]
Why Pareto Analysis
Cellular Finance was informed by its Finance Department that the company’s total overhead costs had increased considerably in the last three quarters and that immediate attention was required. The company embarked on a major cost cutting exercise, indefinitely suspending all further recruitment, promotions, financial incentives, as well as a reduction in training man-hours.
Now, while the organisation found some respite from the problem of overhead costs it saw a corresponding increase in employee attrition and a loss in productivity.
Management revisited the overhead cost issue and realised one crucial fact: there were just too many variables contributing to the overhead costs to be worked on simultaneously. Prioritisation was the need of the hour. The organization needed to figure which variables were key contributors to overheads costs and then tackle these first. They decided to use a method called the Pareto Analysis.
Once the Pareto Analysis exercise was concluded, the data revealed that while overhead costs was indeed a problem, it was travel that accounted for nearly 73% increase in overhead costs.
The company realised that reducing training costs, incentives, new recruitments and so on had probably worked against it, seeing how it lost good employees, which further resulted in loss of productivity.
Now, armed with this new data point, Cellular Finance focused its efforts on reducing its travel costs. They explored alternatives to business travel – and finally saw their overhead costs drop significantly.
Moral of this story: Put your efforts where they will make the most difference.
In the last session, we explored how to use root cause analysis to arrive at the source of a problem. Now, in most cases, there would be more than one root cause identified. The need then would be to isolate those causes that we must prioritise. Pareto Analysis helps us achieve this end.
Identifying the Significant Few
Research has shown that the 80/20 rule applies to various aspects of business. For example.
• 80% of customer complaints arise from 20% of causes
• 80% of delays in the schedule result from 20% of the possible causes of the delays.
• 20% of systems defects cause 80% of its problems.
In other words:
80% of the output results from 20% of the inputs
First discovered by Vilfredo Pareto, the noted Italian economist, in 1906, this phenomenon came to be known as “The 80-20 Rule” or the “Pareto Principle”. It was also commonly referred to as “the significant few and trivial many”.
Pareto Analysis focuses on finding the 20% inputs that are causing 80% of your troubles. Now, twenty is an indicative number. The focus of a Pareto analysis is finding out the significant causes of your trouble and not a strict 20% of the causes.

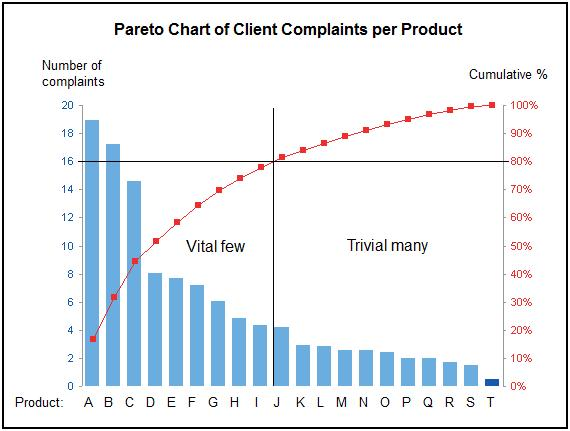
See this chart:
The products listed up to the point where the cumulative % line curve reaches 80%, are the “vital few” we need to focus on. In this case, Products A to I are the cause of 80% of the complaints. Now, don’t worry if you did not understand any of the terms mentioned in the chart. We’ll break this down for you at length in the subsequent lesson.
When to use a Pareto Analysis
A Pareto Analysis lends itself best to the following situations:
a. When there are many problems or causes and you want to prioritise the most significant ones
b. When historical data on the related causes is available
c. When the causes of the problems can be expressed in terms of frequency (or represented by any other numerical unit, like rating, costs, etc.)
Where Pareto Analysis Can be Used: An Illustration
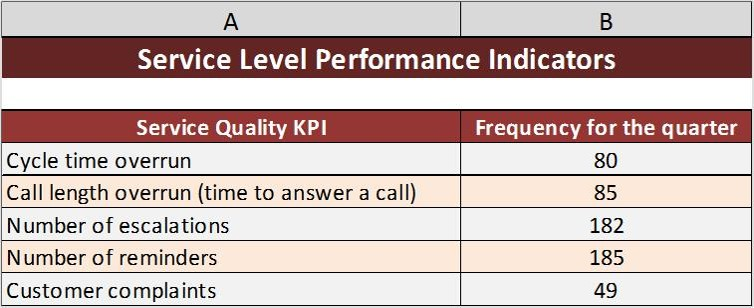
A contact centre was investigating the causes of dropping service level performance indicators. The data gathered for the service level performance indicators were grouped under the following categories:

• Cycle time overrun
• Call length overrun (time to answer a call)
• Number of escalations
• Number of reminders
• Customer complaints
Here, frequency of each KPI breach can be noted. Such cases lend themselves to a Pareto Analysis.
What if No Data Exists
Where data – such as frequency or derived ratings for root causes to a problem – isn’t available, a Pareto Analysis cannot be conducted. For instance, a root cause like “Obsolete technology”, cannot be expressed as a frequency. Similarly, ‘Lack of automated procedures’ cannot be expressed in terms of frequency and in such cases a Pareto Analysis cannot be applied.
In the next lesson, we will learn how to conduct a Pareto Analysis. For now, please take the quiz below.
[/showhide]

